Utilizing social media marketing is a crucial step in growing any business in today’s digital world. Analyzing a company’s social media metrics is becoming more important as more users take to the world-wide web. Whether you’re trying to increase your return on investment (ROI) or build your following, there’s an overwhelming amount of information to know.
That’s why we’re here to tell you the most important social media metrics you should be tracking for your business, and why:
Facebook Metrics
With over 1.8 billion monthly users, Facebook is arguably the most effective platform for social media marketing. Therefore, companies have taken advantage of the platform’s user-friendly interface to create online campaigns. To ensure your campaign performs well, make sure to track the following metrics:
1. Engagement Time – The optimal time when your page fans are online.
When scheduling content to your page, you want to make sure that your posts can get as many pieces of engagement as possible. That’s why looking at your page’s optimal engagement time is important.
To access your engagement time on Facebook, go to your business manager page. Click on “Insights” then “Posts” on the left-hand side. Make sure “When Your Fans Are Online” is selected to see a full view of online users during the week. You can view the daily peak time for posting by hovering your mouse over each day, or you can use the overall optimal time shown by the initial graph.
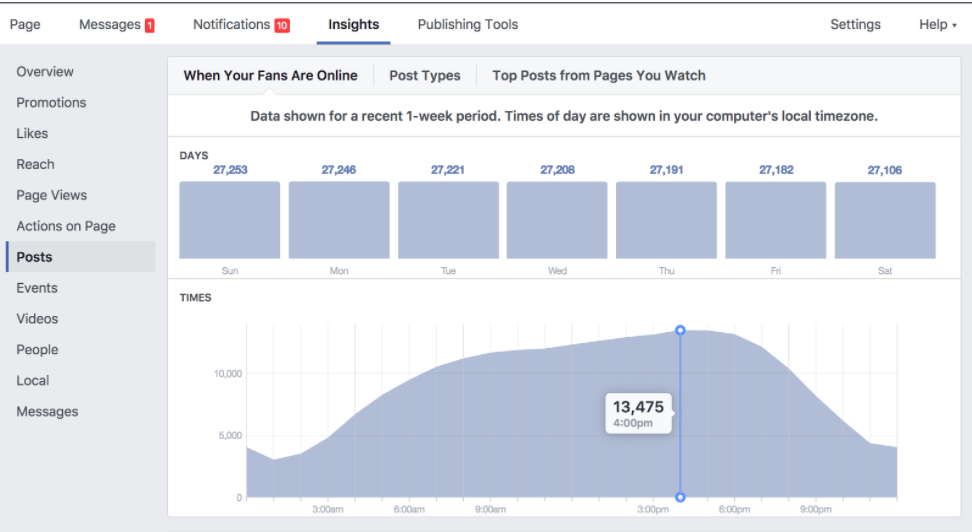
Example of Facebook Post Insights
If your page has a large fan base, but doesn’t seem to be getting many likes, comments, or shares, looking at the engagement time is a good place to start. You can use Facebook Insights or SOCi’s peak time tool to see when your fans are most likely to engage with your content.
2. Page Likes – The number of users who “Like” your page and therefore see your content.
One of the most important parts of having a Facebook page is having page like fans. Not only does having several page likes increase the number of users who see your content, but it can also up your brand’s authenticity.
To access insights about your page likes, you can simply click on the number of likes on the right-hand side of your homepage.
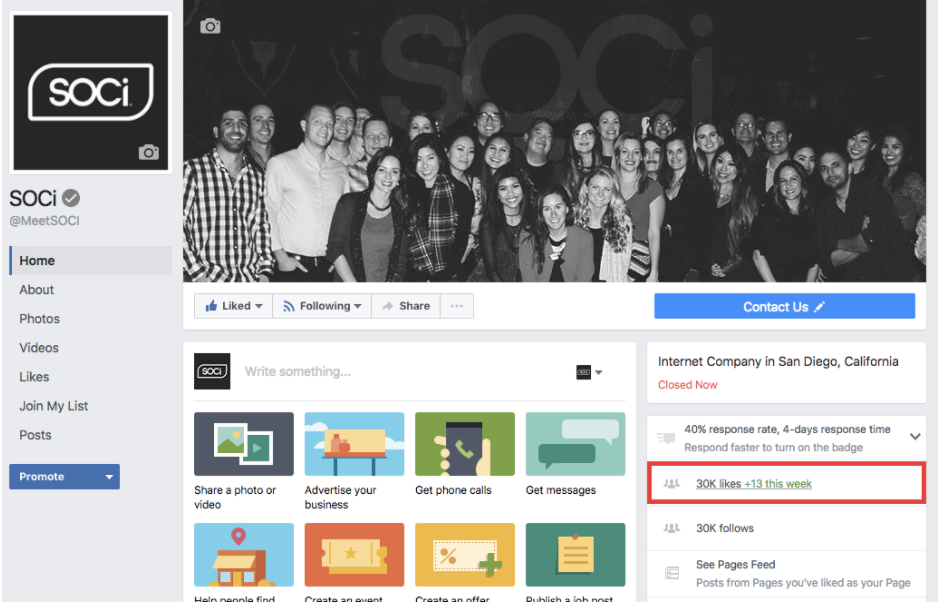
Example of Facebook Page Likes
On this page, you’ll find the total number of page likes as of today, as well as the number of fans you’ve gained and lost over a specific time period.
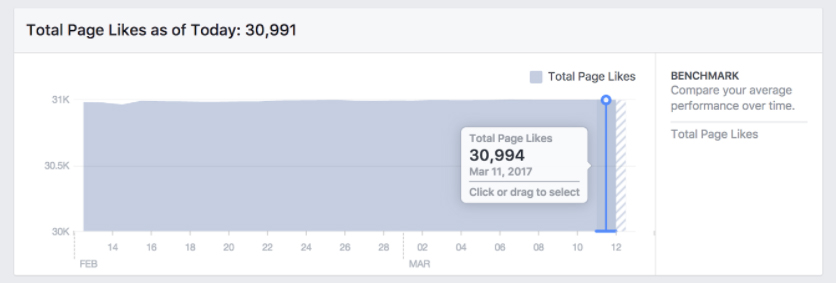
Facebook Page Likes Example
These numbers should indicate to you how your page is performing. If you’re on an upward trend of page likes, it’s a sign that your content and overall strategy is grabbing the attention of new fans. Nice job! However, if your page is losing fans, you might want to consider looking at your post frequency, or the type of content that is publishing to your page. As a rule of thumb, it’s important to keep your page active, and more importantly, relevant to your target audience. This way, your content can ride Facebook’s algorithm in a way that can increase exposure, and get you new page likes.
3. Engagements – The number of times people interact with your content. Can be measured as likes, shares, reactions, and comments.
Engagements are one of the most important metrics to track on any page. Why? They represent your users actively interacting with your content. These metrics show up as likes, shares, reactions, or comments. Essentially, the more engagements you’re getting on your page, the better your content is performing.
To access your engagement metrics, go to the Insights tab on your page. Make sure that the Overview tab is selected on the Insights page. Scroll down to see your recent posts. Next to each post, Facebook will show you the reach and engagement. Under the engagement section, you can see Post Clicks in blue, and Reactions, Comments, and Shares in purple.
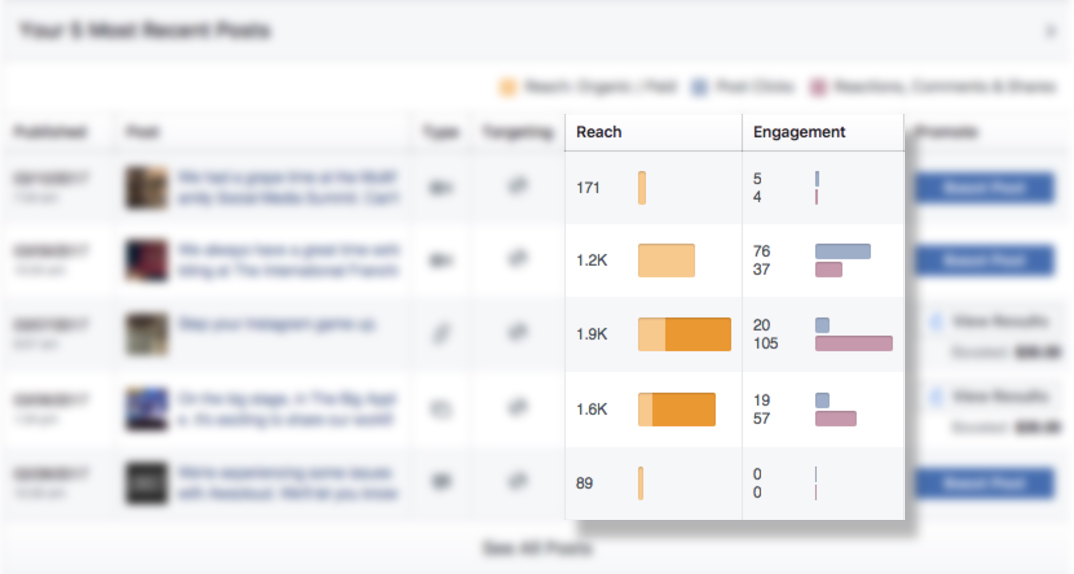
Facebook Post Metrics Example
By clicking on the post itself, you can get a more detailed idea of how your users engaged with your content.
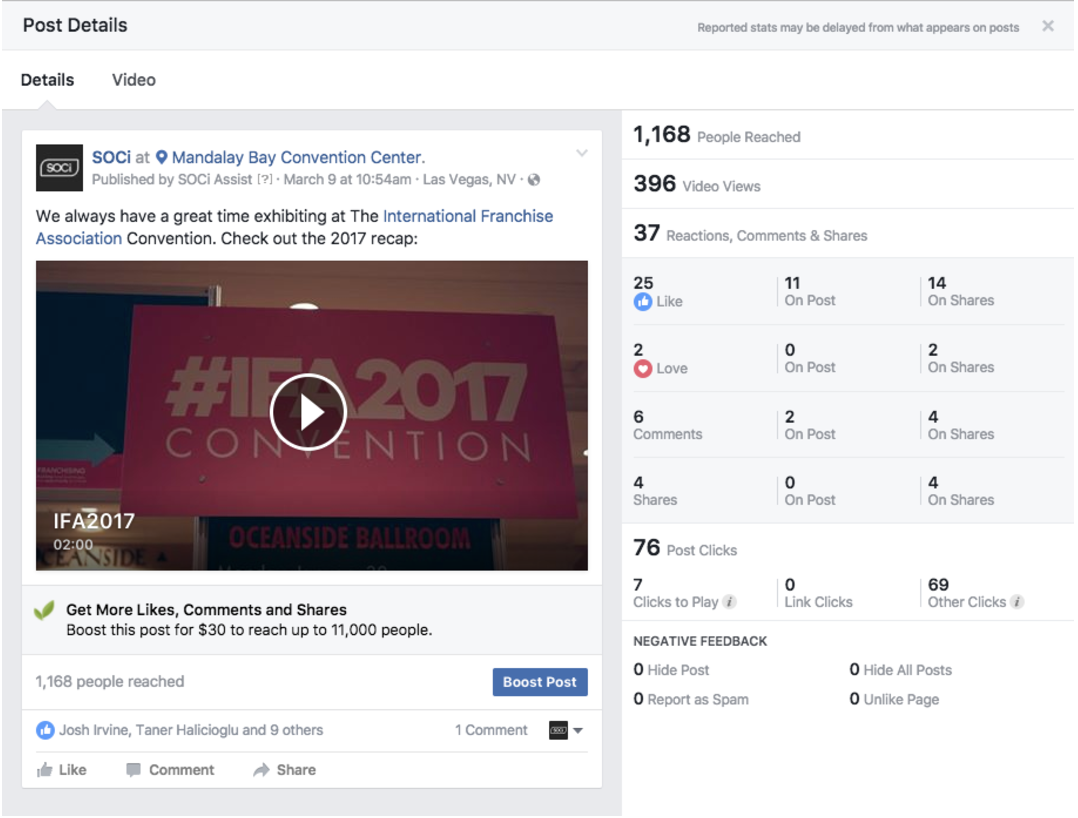
Facebook Post Metrics Example
If your page gets low engagement, it’s important to assess these metrics to see how you can improve. For example, you can easily see which posts outperformed others based on these engagement metrics. If you want to go the extra mile, you can perform some A/B testing to really see what types of posts give you the most engagements.
4. Reach – The total number of users (fans or non-fans) who saw your post on their timeline.
On Facebook, reach is one of the best ways to see how many unique users saw your content. It measures every unique user, whether they are a fan of your page, or not.
Within reach, there are three main subcategories: Paid, Organic, and Viral. Paid reach refers to the number of users who saw your ad (ex. Boosted content). Organic reach focuses more on the number of users who saw your content, with no money involved. Finally, Viral reach refers to the number of people who saw your post via another user’s interaction with your comment (through shares, comments, or likes).
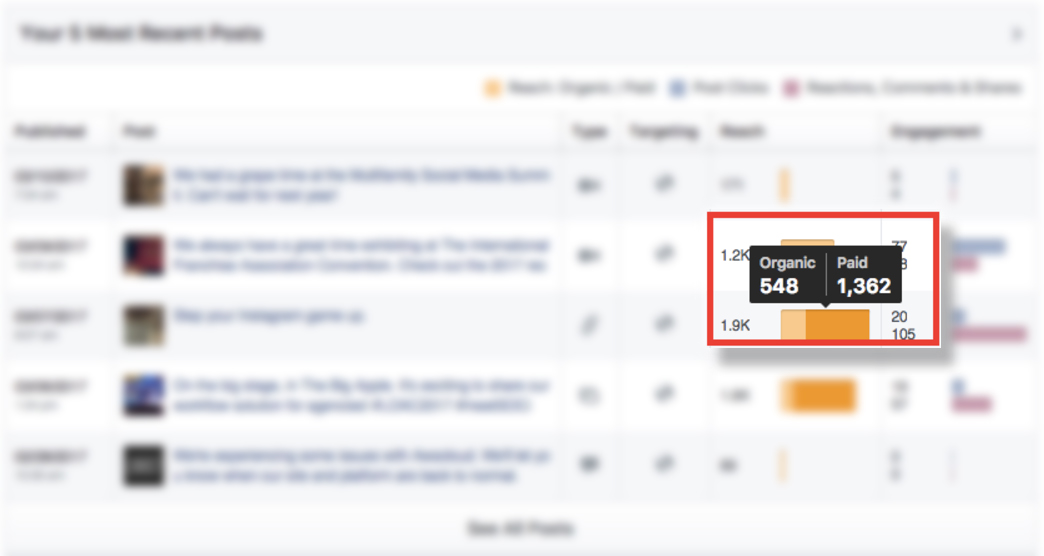
Facebook Organic and Paid Metrics Example
In a perfect world, everybody would get viral reach with all of their posts. However, as we all know, it’s not that simple. One way you can increase your reach potential is to curate and create quality content. For example, simply posting an article with copy that has no call-to-action, or CTA won’t do much to engage users. If you get more of these engagements, the more likely it is that your post will show up on more newsfeeds, resulting in higher reach.
You can also boost your posts so that they appear higher and more frequently on people’s timelines.
5. Demographics – Users, based on different factors, who are grouped into different audiences by Facebook.
When brainstorming your strategy, one of the most important metrics to consider is your demographic. Who are you targeting? Luckily, Facebook can get extremely specific and in-depth with the type of user you are trying to reach.
To access your demographics, click on “Insights” on your page, then select “People” on the left-hand side.
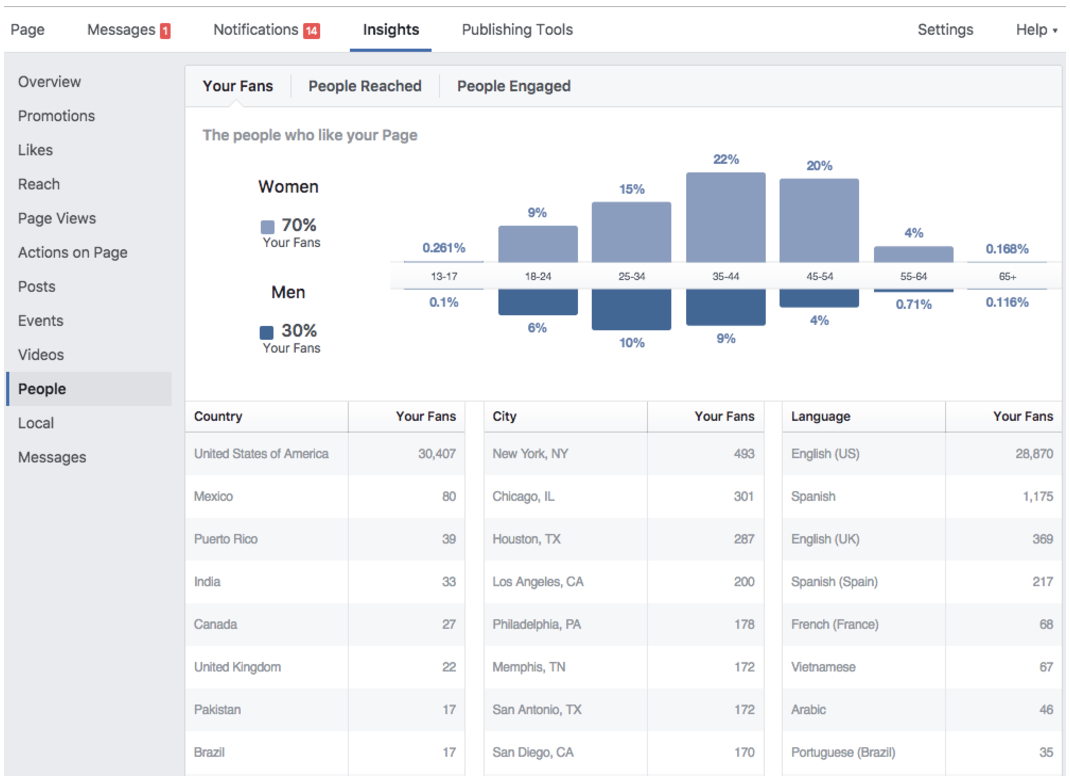
Facebook Audience Metrics Example
On this page, Facebook breaks down your audience based on several factors. This tool really comes in handy after you’ve already been publishing to Facebook for a little while. You can get an idea of who interacted with your content over time. After doing some more audience research, you can target your future campaigns and alter your strategies to reach specific audiences for better results.
Twitter Metrics
Today, there are over 319 million monthly active users on Twitter. Not only is the platform an excellent space for users to converse with one another, but it’s a great place for brands to establish a stronger persona amongst its followers. However, since Twitter has also become a major news outlet for all things pop culture and current events, it can be difficult for a brand to stand out. Luckily, there are several ways you can use the data collected on Twitter’s platform to properly reach your audience.
One of the best tools that Twitter offers is the Activity Dashboard. On the dashboard, there are several helpful metrics that you can use to up your Twitter game.
1. Impressions – The number of users who saw your tweet.
The number of impressions your content receives on Twitter is important because it directly correlates to the number of people who were exposed to your content. For example, let’s say one of your followers retweeted one of your posts. Then one of their followers saw that retweeted post on their feed. This would count as 2 impressions.
To access your impressions, you’ll want to click on your profile icon, and select “analytics”
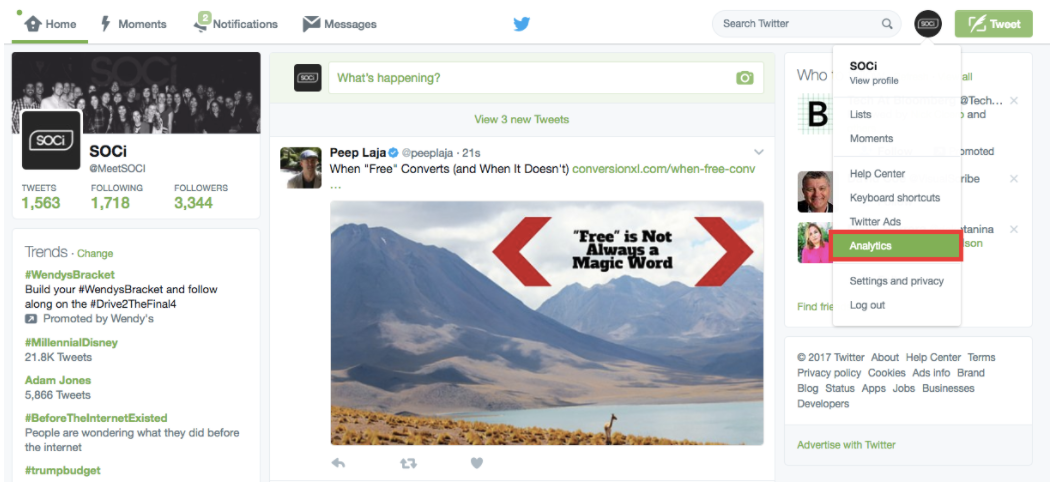
Twitter Insights
Once you’ve arrived at the analytics page, click on “Tweets” on the upper-left corner. You should now have access to your impressions.
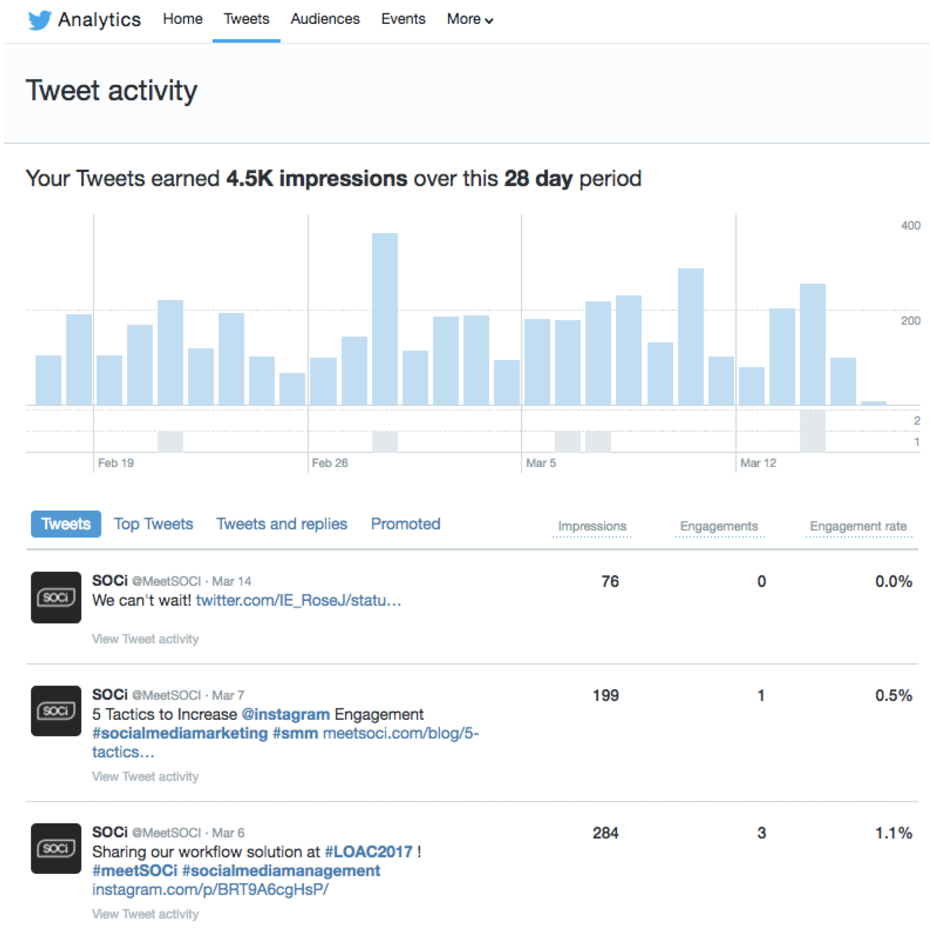
Twitter Metrics Example
If increasing brand awareness for your account is one of your goals, you will definitely want to track your impressions. As soon as a user is exposed to your content, there is a chance they might engage with your post. This is why, creating eye-catching content (such as images and videos) is important, especially on Twitter.
2. Engagements – The number of times a user interacted with your tweet.
Earlier I talked about how important impressions were to your Twitter strategy; they open the door for potential engagement. A high number of engagements means users are not only seeing your content but are interacting–commenting, retweeting, quote tweeting, etc–with your post. The more people that interact with your post, the better chance it has to show up on other user feeds.
Your engagement and engagement rates are conveniently listed next to where you found your impressions earlier. The number under “Engagements” represents the number of times users engaged with your post. The “Engagement rate” however, is the percentage of users who not only saw your content but interacted with it as well.
If your goal is to get more engagements on Twitter, content is your best friend. Although this goes for all your other platforms, Twitter is frequently overlooked. Therefore, upping your content game on Twitter can help you stand out on Twitter feeds. For example, one company that is crushing it on Twitter is DiGiorno Pizza. They utilize emojis, polls, and video content to stand-out in a sea of tweets.
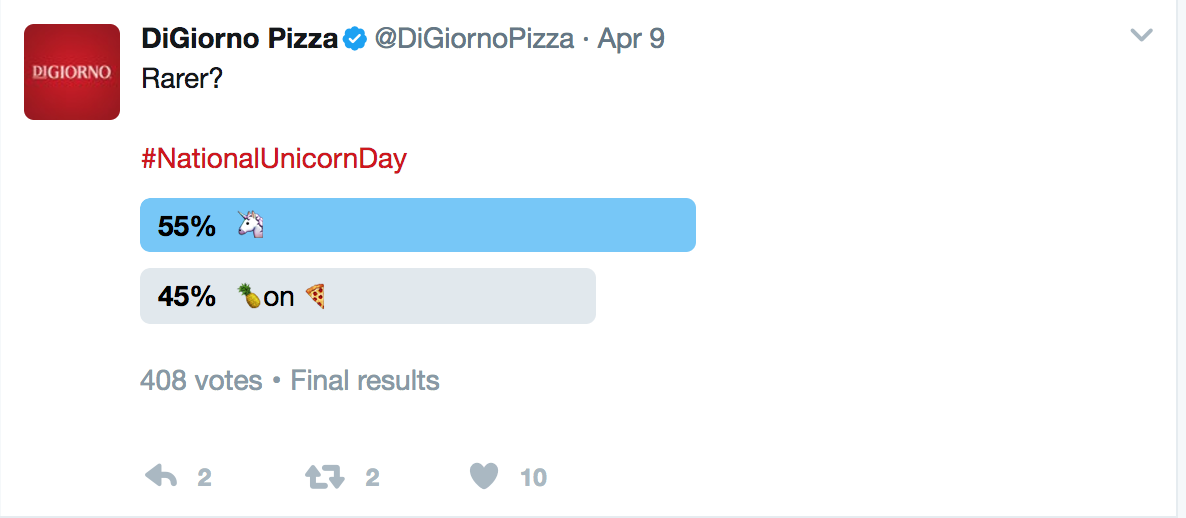
Twitter Poll Example
3. Audiences – Your followers, broken down by several factors such as interests, behaviors, gender, location, and age.
Know your audience. It’s as simple as that. Understanding who will actually engage with your content on Twitter is an integral part of your strategy. The better you understand your audience, the more tailored you can make your content to their interests and behaviors.
Accessing your audience on Twitter is relatively simple. By going back into Twitter Insights, you can find detailed information on your demographic.
Luckily, Twitter breaks down your audience to very specific audiences. You can see your audience’s demographic, interests, lifestyle, purchasing behavior, and mobile footprint all from the insights tool. This type of in-depth information can really help you tailor your content and overall strategy for optimal results.
Tracking your social media metrics should be a priority for your digital strategy. Whether your goal is to increase brand awareness, or increase traffic onto your page, you should take advantage of every metric your platform provides. By collecting these numbers, you can gain valuable insight into your audience, your content, and your overall strategy.
Are we missing any important metrics that you consistently track? Let us know.
Cookie Settings
Terms of Service
Privacy Notice
Information Security
Accessibility Statement
Contact
![]() Your Privacy Choices
Your Privacy Choices
This site uses chatbots to record your interactions on our site for our consent recordkeeping and provide customer support. Our technology provider may also collect and aggregate this data on our site for their purposes. See our Privacy Notice to learn more about our privacy practices.