Mastering Social Media Reporting: Your Step-by-Step Guide
Table of Contents
In the dynamic world of digital marketing, it’s essential to understand your social media presence’s impact on your organization. That’s why social media reporting is a necessary skill for multi-location marketers.
A well-crafted social media report presents digestible social data for your team. Ideally, the report will illustrate that your social media content delivers meaningful value to your followers and potential customers to help you achieve your overall marketing goals.
In this blog post, we unveil the art of creating compelling social media reports that captivate your team and drive actual results.
What is a Social Media Report?
A social media report comprehensively summarizes relevant data and key insights about a business or brand’s social media performance over various timeframes.
Social media reports will differ based on your platforms, activities, audience, and goals.
For instance, if you’re a multi-location enterprise, one social media report might focus on how a business location performs on various social networks. In contrast, another report might compare the social performance of two locations to extract social media insights.
Regardless of the social media report, you must have clear goals ahead of time. Now that you understand what a social media report is, let’s get into how to create one.
Step 1: Decide on Social Media Reporting Metrics and Goals
Before starting a social media campaign, it’s essential to have specific goals and key performance indicators (KPIs) defined. Knowing these KPIs ahead of time is essential so you can correctly build out and measure the performance of your social media campaigns. Below are some of the most common social media KPIs.
Brand Awareness and Engagement KPIs
These KPIs measure how many users or accounts come across your social media channels and content. They also measure the quantity and quality of interactions from these audiences.
Follower count or growth: The rate at which social media accounts gain new followers over a period of time.
Impressions: The total number of times a social media post or ad displays on users’ screens. Note, impressions don’t factor in the same account seeing a post multiple times.
Reach: The total number of unique users that have seen a social media post or ad. Reach does factor in how many times one user saw a post; e.g., if an account saw the same post three times, the post’s reach is one.
Cost per thousand impressions (CPM): The cost of reaching one thousand users with a social media ad.
- Total ad spend / total ad impressions x 1,000 = Cost per thousand impressions (CPM)
Engagements: The total interactions users have with a social media post. You should narrow these engagements down by type:
- Likes
- Comments
- Shares
- Clicks
Clicks: Traditionally, clicks are the number of times users click on a call-to-action (CTA). However, they’ve since extended to clicking on an Instagram or LinkedIn caption to expand the caption.
Conversion KPIs
These KPIs measure your social media campaign’s effectiveness to lead to actionable outcomes that put consumers further down the marketing funnel, such as email sign-ups or online purchases.
Conversion rate: The act of a user completing a desired action, such as making a purchase, requesting a demo, or signing up for an email list as a result of a social media campaign.
- Conversions / total clicks x 100 = Conversion rate percentage
Click-through rate (CTR): The percentage of people who viewed your post and clicked on the CTA.
- Total clicks / total impressions x 100 = CTR percentage
Cost per click (CPC): The average cost incurred for each click on a social media ad or link.
- Total ad spend / total measured clicks = CPC
Step 2: Consider Reporting Frequency
With social media reporting, you always want to consider the timeframe of reports. How many campaigns you run and how often your marketing team is measured on goals will influence how frequently you report.
Businesses typically produce weekly, monthly, quarterly, and annual reports. Here’s how to make the best use of each reporting period.
Weekly: Best for spotting new and trending topics and pullings insights from A/B tests, such as the best time of day to post on different platforms.
Monthly: Monthly reports help you assess changes in your converting KPI metrics, such as clicked links and conversion rates. Note, some companies use a 28-day period to ensure consistency across all months.
Quarterly: Quarterly reports give you an extensive view and allow you to analyze overall social performance. With quarterly reports, you can compare the success of multiple week-long or monthly campaigns. You’ll also see more fluctuation in growth KPIs such as follower count or reach.
To stay consistent, you can use a 90-day period versus three months.
Annually: Annual reports are best for reviewing year-over-year data to inform your overall marketing strategy better. They’re also helpful when creating an annual budget.
With all of these timeframes and reports, it’s important to compare period over period, such as month over month or a quarter from one year compared to the same quarter from the previous year.
These comparisons can bring to light new data and trends you otherwise might not have noticed.
Step 3: Define Your Audience and Key Stakeholders
Another critical factor to consider when developing social media reports is who your target audience is. Defining who your reports are for will help you determine the level of detail to include and areas to focus on.
For instance, how much do they already know about social media? Do you need to define specific terms? What do they care about most — revenue from campaigns or brand awareness?
Regardless of the audience, your social media reports and presentations should have an easy-to-follow structure.
Step 4: Create a Clean Reporting Structure
The structure of your social media reports is crucial for presenting data in a clear and organized manner. A strong structure will keep your audience engaged. Below are segments to include in your social media reports.
Executive summary
To start, provide a concise overview of the report’s key findings and highlights. These can include high-performing KPIs or metrics to give stakeholders a quick snapshot of social media performance or areas of improvement.
Benchmarks
Let your audience know about your social media campaigns’ original goals and if you met, surpassed, or failed to reach these goals. You can also include competitor benchmarks to help your audience better understand the competitive landscape and where your brand stands in comparison.
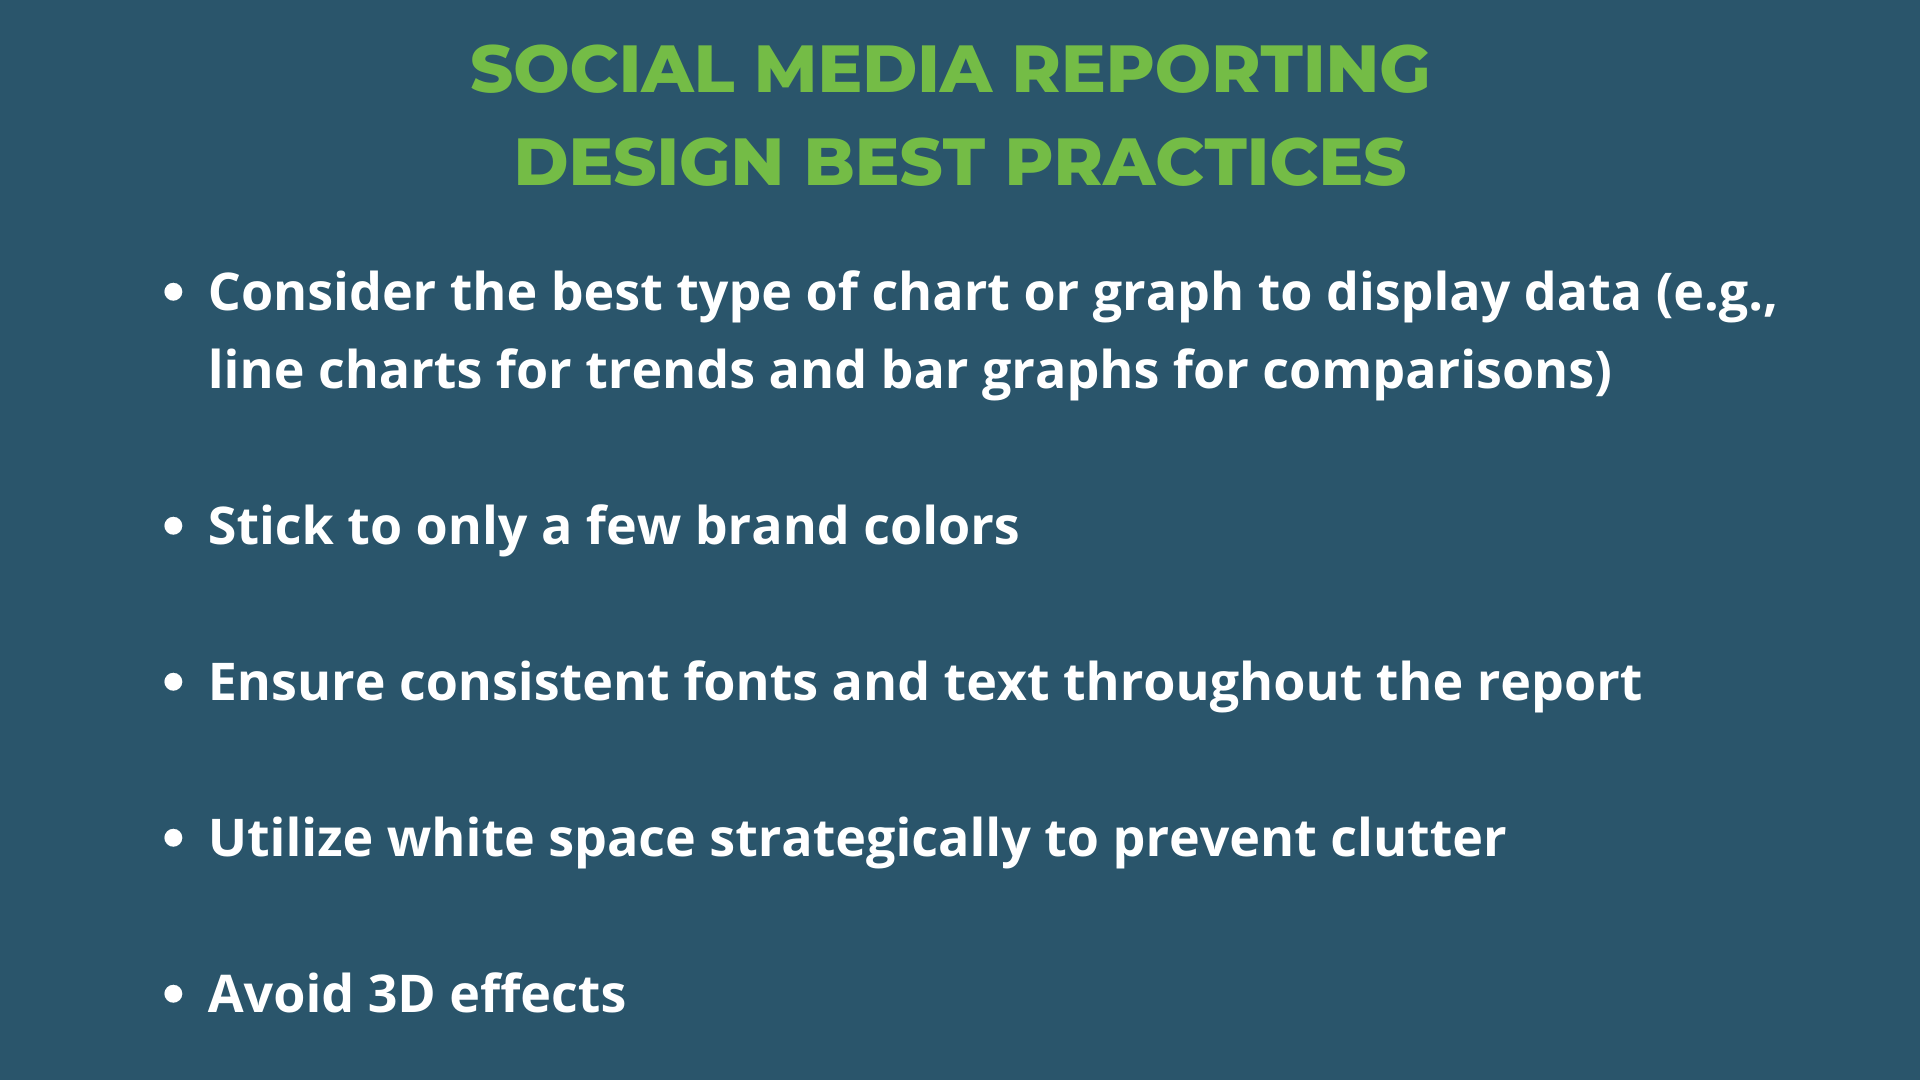
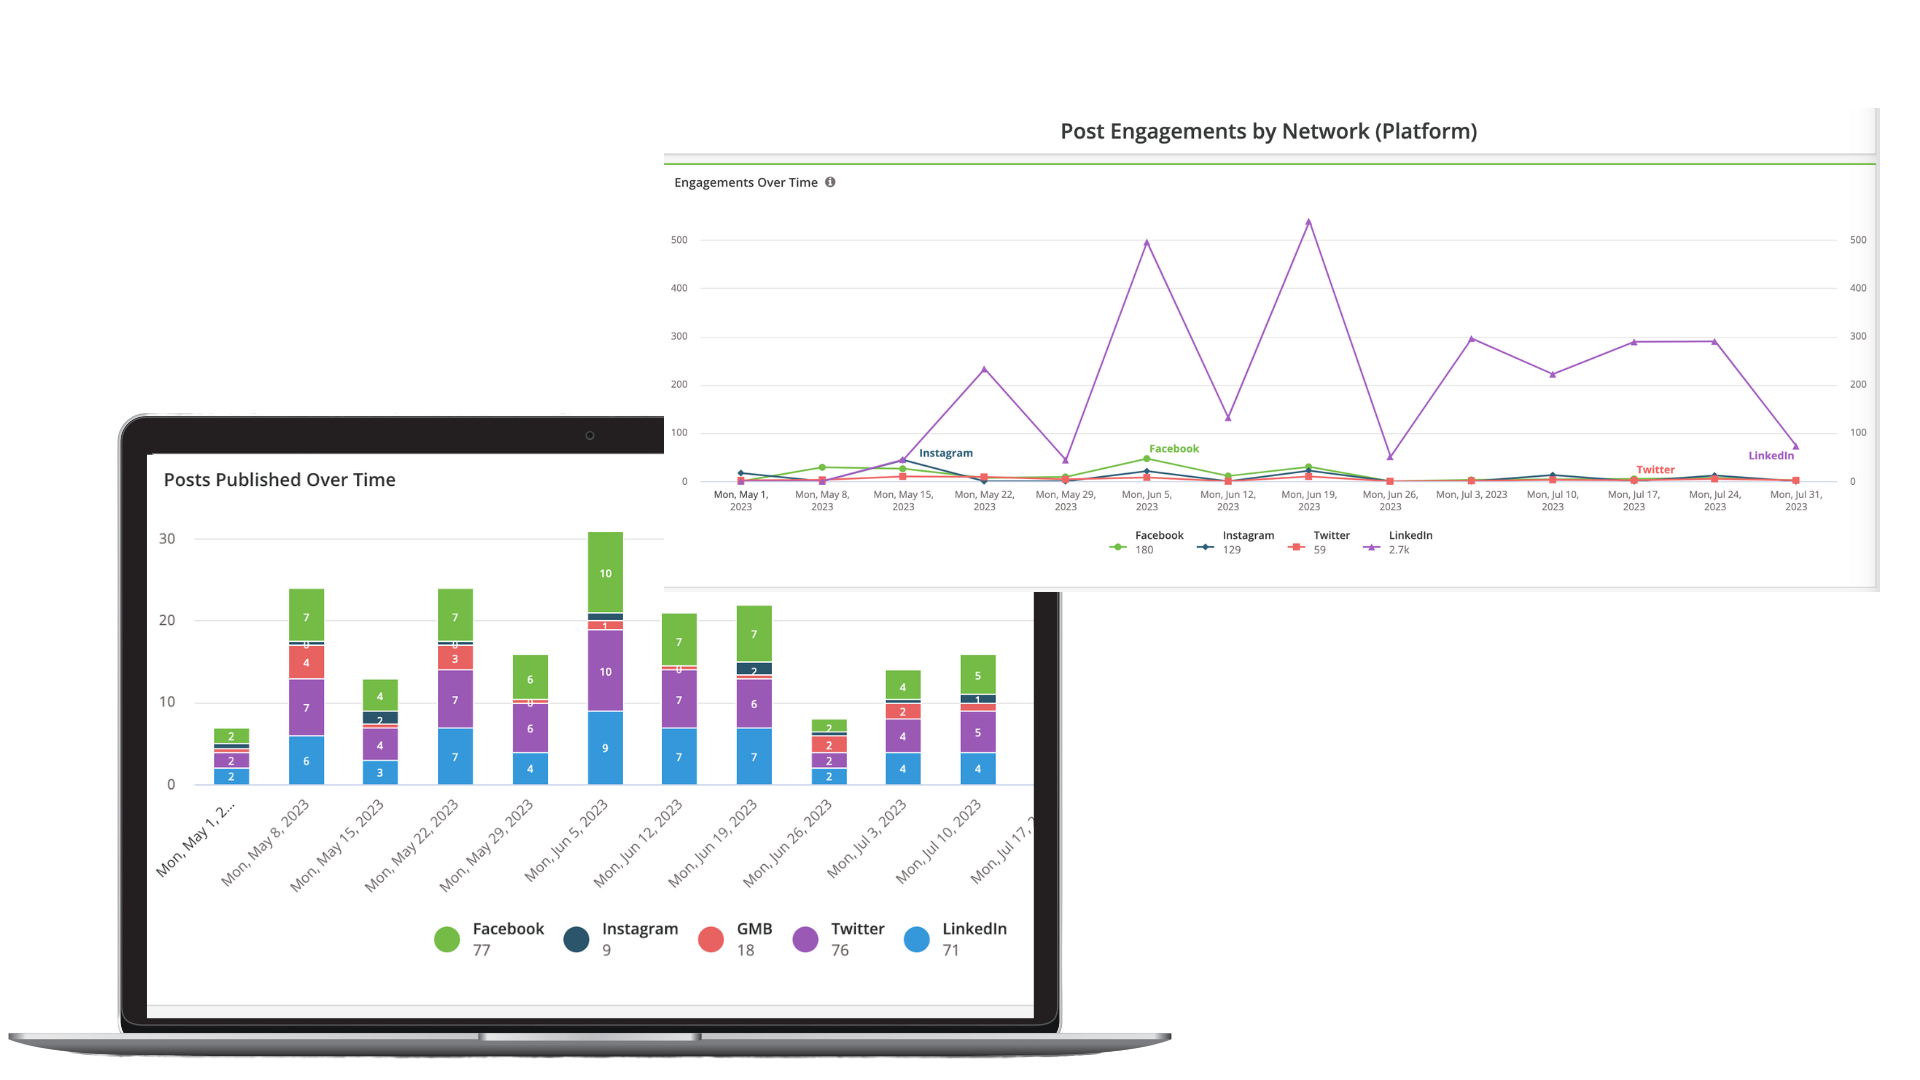
Visually appealing data
You want to ensure your social media reports are easily digestible, especially at first glance. Therefore, you must include visually appealing data highlighting key takeaways or milestones.
We recommend these design best practices:
Recommendations and an Action Plan
Your social media reports should always end with high-level takeaways and an action plan.
You should base your recommendations on the data presented in the report. Your action plan should include upcoming social media campaigns, new benchmarks or goals, and an implementation strategy to meet those goals. It’s also worth mentioning any upcoming changes in social media algorithms or trends.
Step 5: Utilize The Right Social Media Reporting Tools
There are two categories of social media analytics and reporting tools you need to consider using: native analytics tools and third-party analytics tools. Let’s examine the top native analytics tools first.
As you would expect, native analytics tools are directly connected to social platforms. For instance, Meta uses Meta Business Suite as its native analytics tool.
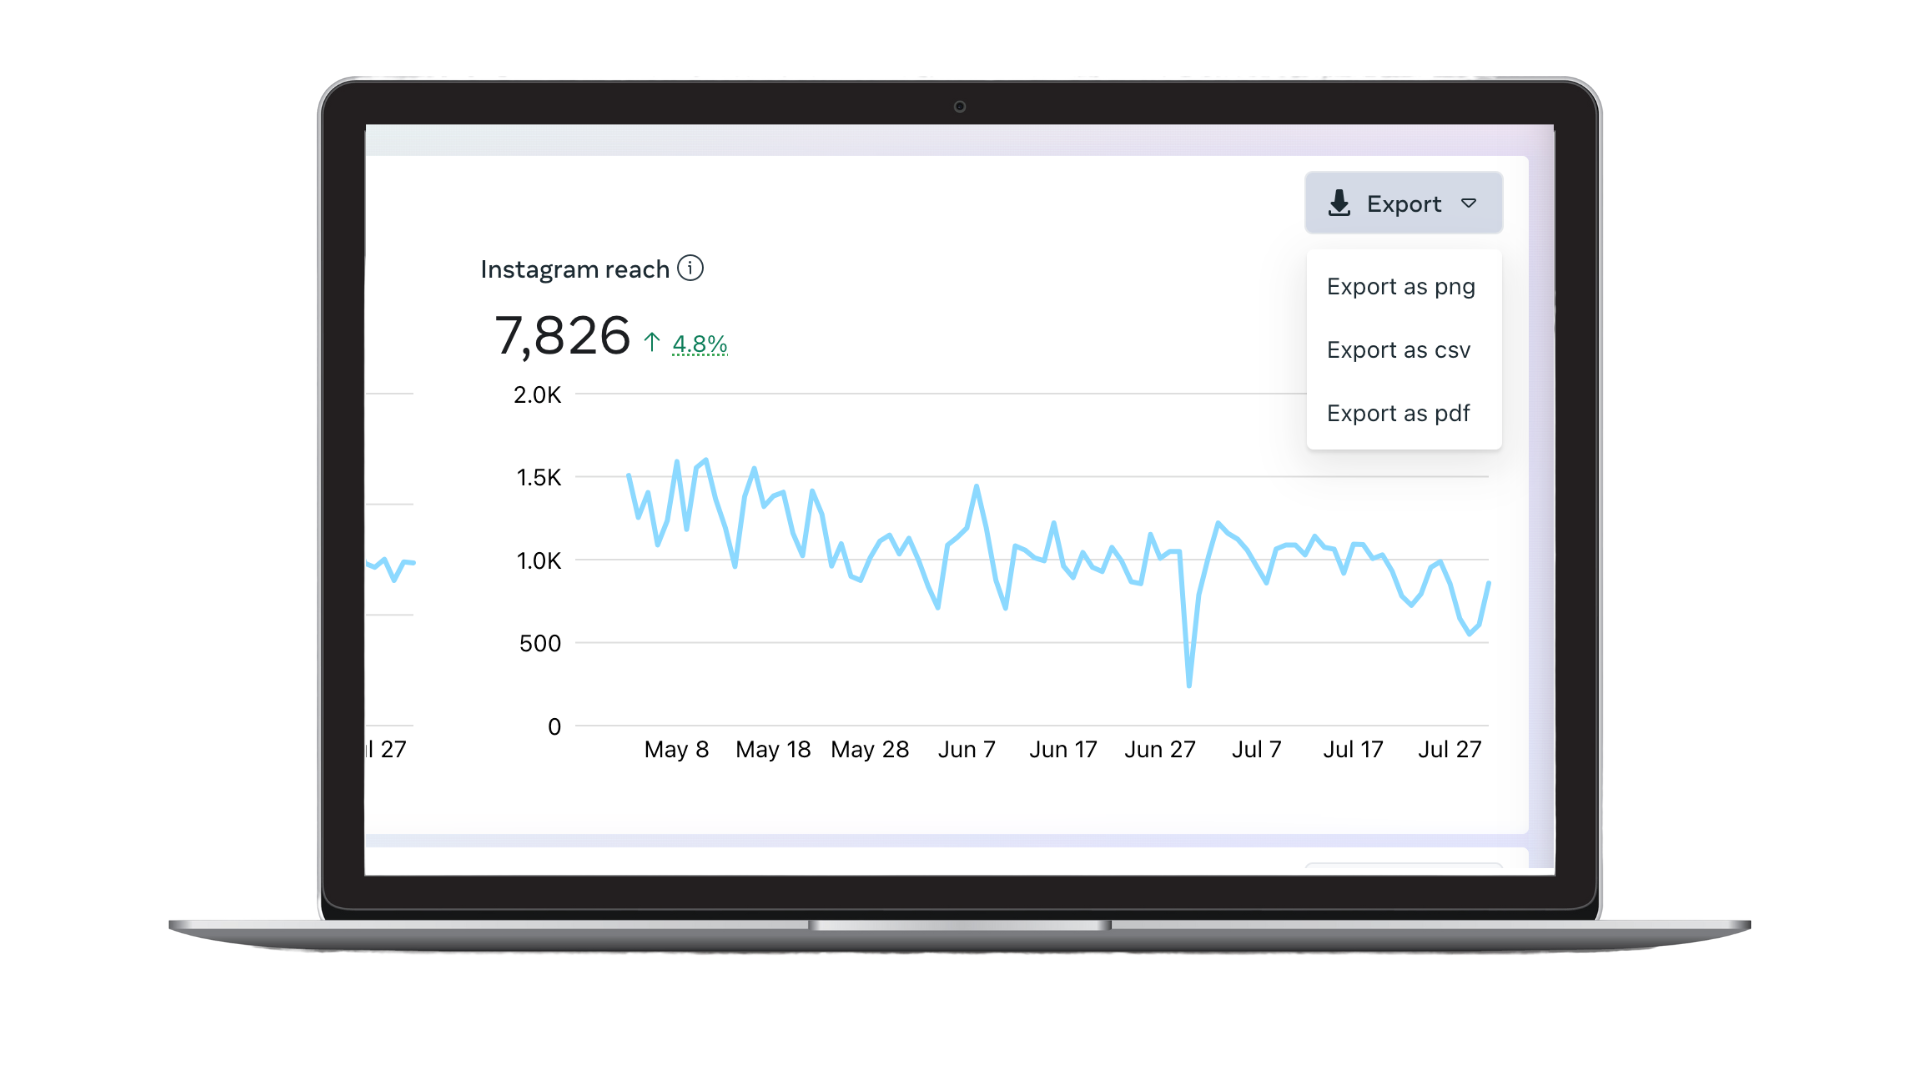
Meta Business Suite
If you’re using Facebook or Instagram, you can leverage Meta Business Suite. From the reporting tool, you can look at data for both platforms.
To access Meta Business Suite’s reports and insights, log in at https://business.facebook.com/. Then, click “Insights” on the left-hand panel. You can see Overview, Results, Audience, and Benchmarking reports there. You can also export the Results and Audience reports as a PNG, CSV, or PDF.
For more information on running and analyzing Facebook ads, read our blog post on Facebook advertising strategy.
Twitter Analytics
Twitter, recently renamed “X,” also has its own native analytics and reporting capabilities. To access, log into your Twitter account and click the ellipsis button with “More” next to it. Then, click “Creator Studio” and “Analytics” from the drop-down menu.
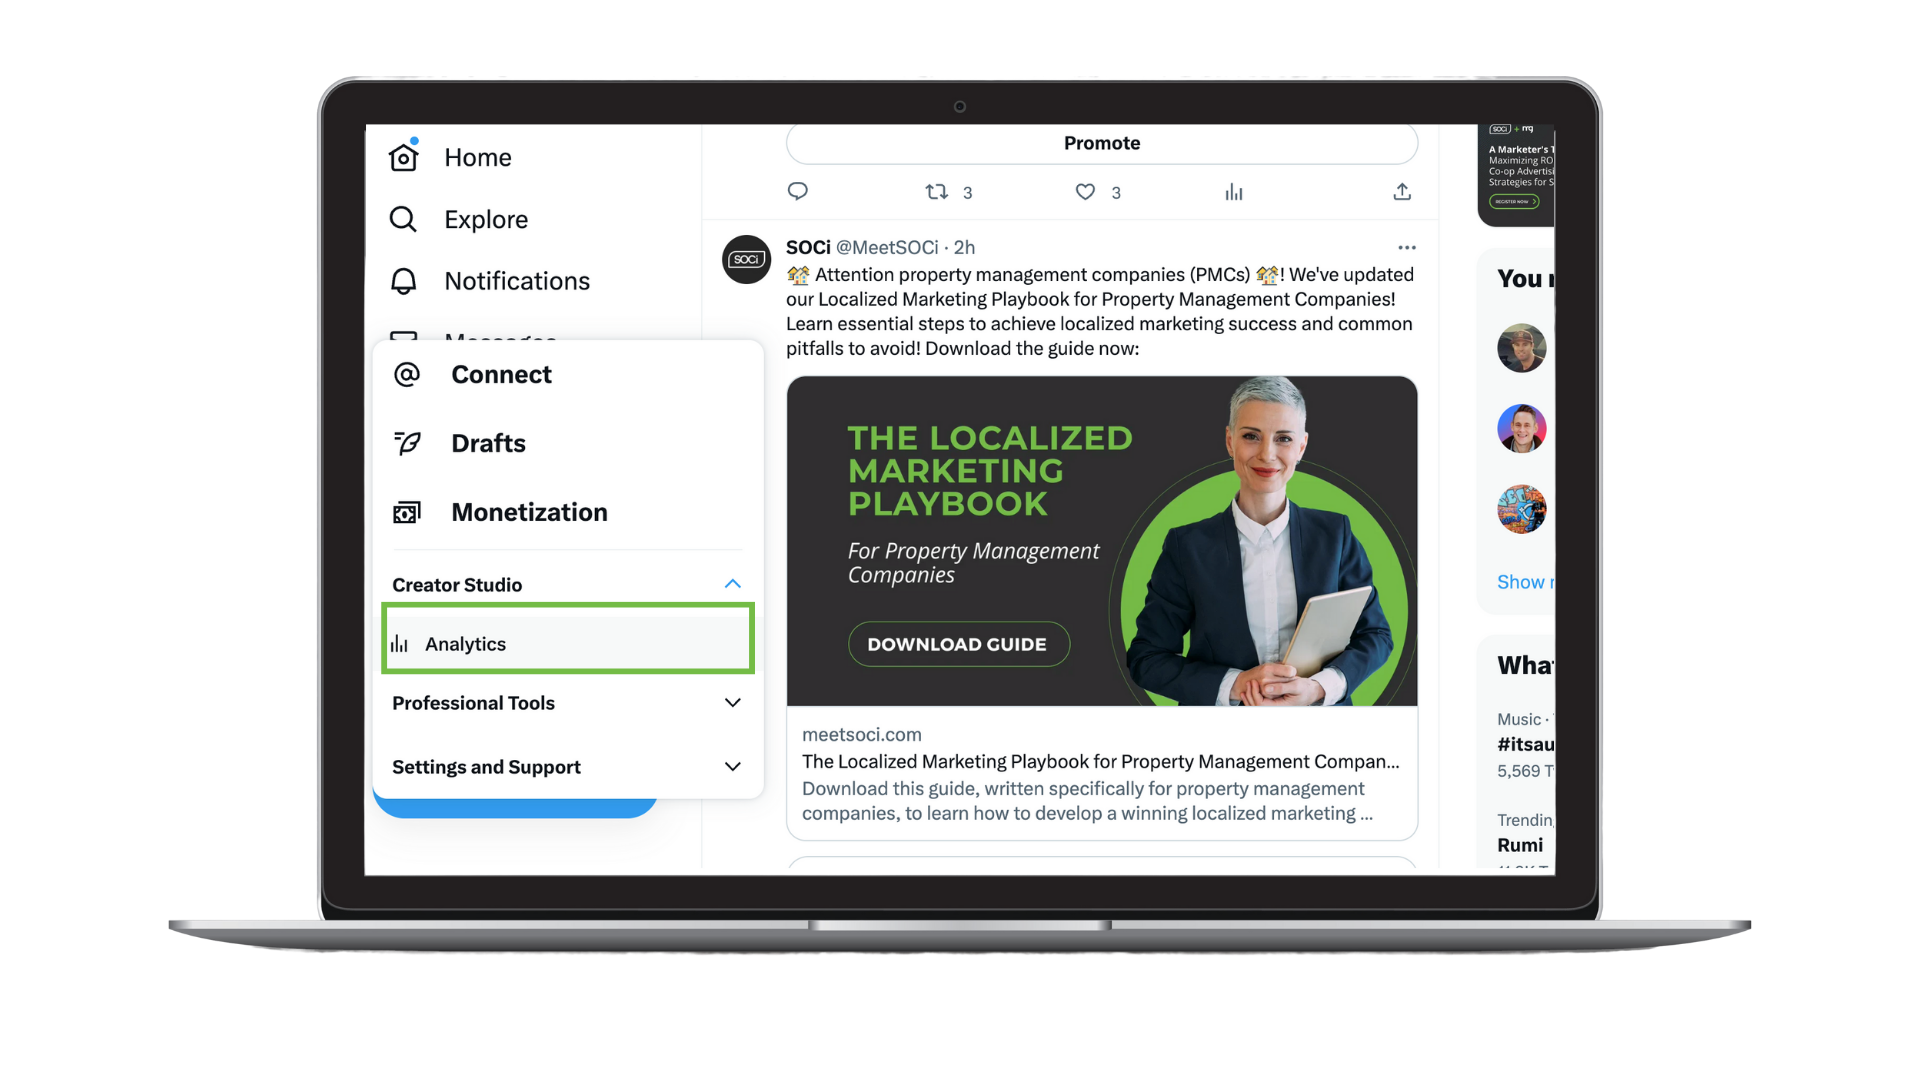
You can also export Twitter data, but only as a CSV file.
Note, to run ads on Twitter, your organization’s account needs to be subscribed to Twitter Blue or Verified Organizations, or received a gold checkmark.
LinkedIn Analytics
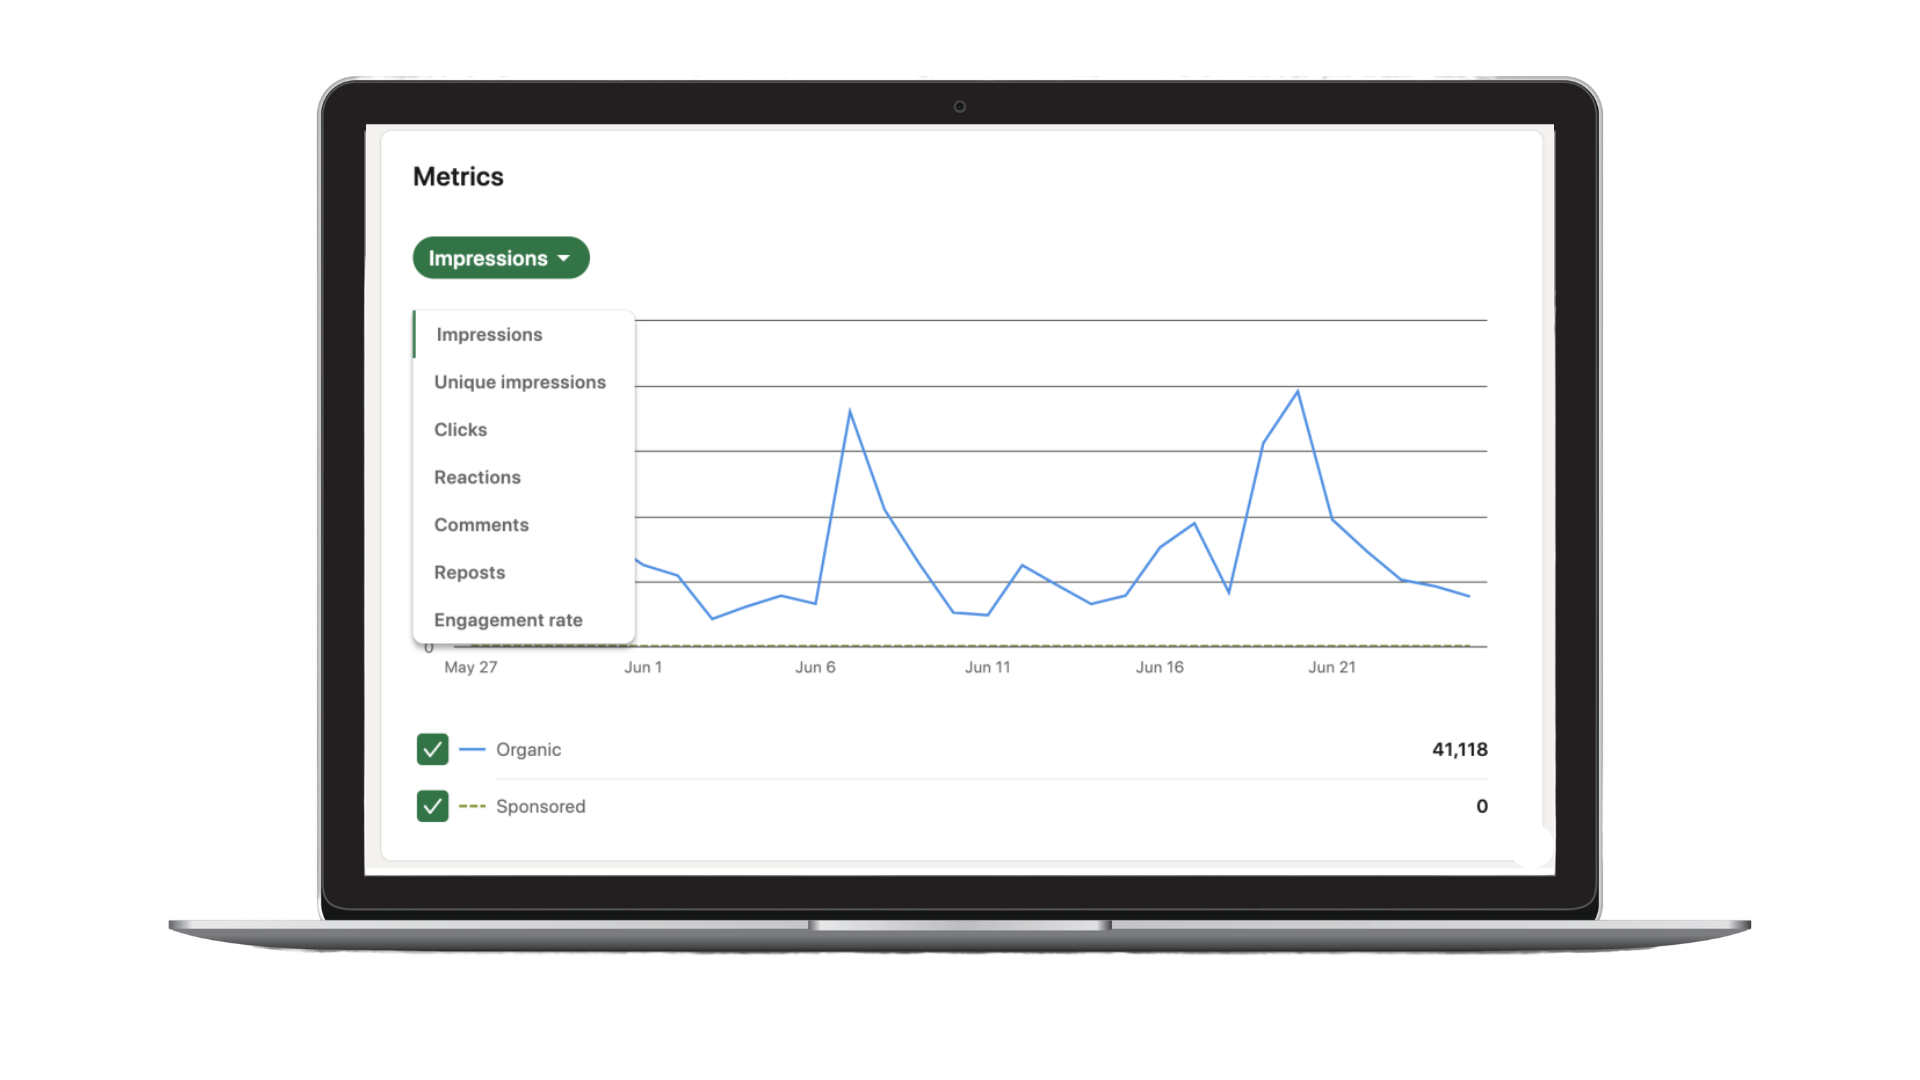
LinkedIn is another essential social media platform with its own analytics tool. LinkedIn Analytics allows you to look into analytics in seven areas:
- Visitors
- Followers
- Leads
- Content
- Competitors
- Employee advocacy
- Employer brand
In each area, you can dig deeper into the data by looking at KPIs such as page views, engagement rate, clicks, etc.
Courtesy of Metricool
As a social media marketer, it’s useful to know how to use these native analytics tools. They’re also helpful in creating data-driven and visually appealing social media reports. That said, they’re limited in their capabilities — especially for multi-location enterprises.
Social Media Analytics and Reporting for Multi-Location Brands
We’ve discussed native social media analytics and reporting tools. What about third-party analytics tools, particularly for multi-location businesses?
That’s where SOCi Social comes into play. SOCi Social enables brands to manage and deploy localized content across multiple business locations while maintaining brand consistency.
In our social media tool, you can host content in content libraries that are scored and sorted by performance. Then, through our scheduler, you can deploy group or individual social posts at peak times across Facebook, Instagram, LinkedIn, Twitter, and Google.
Analytics-wise, you can examine essential KPI metrics for each platform. Moreover, you can compare these metrics across all social media platforms to see which platforms and posts perform best.
With our insights and reporting suite, you can create customizable white-label reports for Facebook, Twitter, and LinkedIn. You can also receive group reports, helping you examine how a specific region of locations perform on social media or a group of low performers over time.
You can now create an engaging social media report and the best analytic tools. For more information on how SOCi can help improve your social media insights and analytic capabilities, request a demo today!

Chi Whitley
Cookie Settings
Terms of Service
Privacy Notice
Information Security
Accessibility Statement
Contact
![]() Your Privacy Choices
Your Privacy Choices
This site uses chatbots to record your interactions on our site for our consent recordkeeping and provide customer support. Our technology provider may also collect and aggregate this data on our site for their purposes. See our Privacy Notice to learn more about our privacy practices.